Influence lines
As I start my new (and third) semester of my masters degree, I will be completing a project based course, Structural Design, to perform the conceptual design of a bridge structure. One of the first tasks to complete is to determine the loading configuration to use in subsequent analysis & design stages. Determining the loading configuration is significantly different for bridge structures than it is for buildings for the main reason that the loads on a bridge are a type of moving load. A moving load can be thought of as the cars we drive or the trains we ride over bridges as we move from our trip origin to our trip destination. It is then of importance in structural engineering to decide on where do the expected moving loads have to be applied on the bridge structure to cause the worst case scenario at least in the structural engineering sense. The remainder of this blog post will explore the topic of influence lines as a solution to determining this worst case loading scenario.
What even are influence lines?
To explain what influence lines are, I will first present the dry and technical engineering definition and subsequently break that definition down into a more readily digestible explanation. The strict engineering principle of influence lines is called the Müller-Breslau principle which simply states:
The IL for any reaction or internal force (shear, moment) corresponds to the deflected shape of the structure produced by removing the capacity of the structure to carry that force and then introducing into the modified (or released) structure a unit deformation that corresponds to the restraint removed.
In this principle, a unit deformation refers to either a positive (absolute or relative) unit displacement in the case of a reaction force and internal shear force, respectively, or a positive relative unit rotation for a internal moment restraint. This principle provides the engineer with a simple procedure to establish the shape of a influence line. These qualitative influence lines can be used to:
- establish the critical position of the moving load on a structure,
- determine the maximum and minimum ordinates of the IL, and
- verify the shape of the IL as correct.
This is a good, strict definition of influence lines but how is this applied to real, engineering problems? To understand this, it is necessary to deconstruct some of the core ideas presented by the Müller-Breslau principle. One should remember the objective or purpose of constructing influence lines is to represent the worst case loading placement of a moving load on the structure. In other words, the goal of a influence line is that it represents the variation of either a reaction force, internal shear force, internal moment, or deflection at a specific point in a structural member as the force moves over the member. To give a specific example, imagine that you are out on a hike with friends and you reach a stream with no bridge. So as you are an engineer you start looking for a fallen tree large to support your weight and long enough to span the stream. The question becomes how large of a tree do you need to safely make it across the stream. This question requires you to understand at which point as you cross will the fallen tree bridge experience the highest bending moment. Intuitively, we understand that for a simple bridge like the one in this story the maximum moment (assuming it is simply-supported) will occur in the middle of the bridge. But where do you have to stand to produce these maximum moment in your bridge? This is where influence lines become very useful since the influence line will be able to tell you, the engineer, where the load has to be located to produce the worst case loading scenario. In the case of the example above, intuitively we know that if the bridge is simply-supported and the load, you walking across, is modeled as a point load, it becomes obvious that you would be in the middle to generate the worst case loading scenario. To further demonstrate this concept the next section will work through constructing a influence line and using the influence line in a stricter mathematical and engineering form.
Example illustrating the construction and use of influence lines
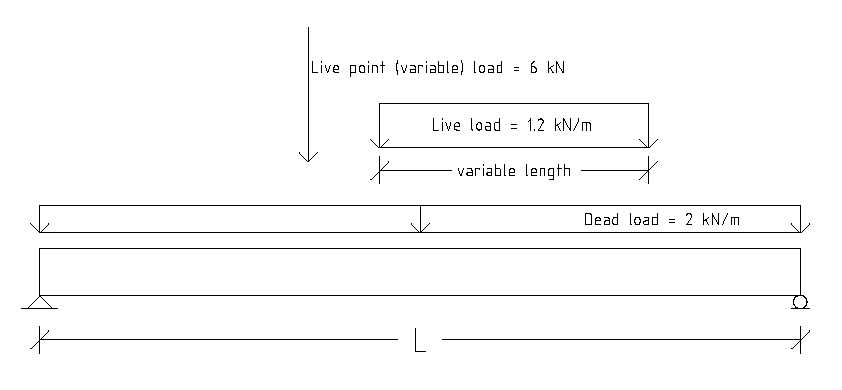
In this example, a beam is to be designed to support a dead weight of \(2.0 kN/m\) and a live load consisting of:
- a \(6.2 kN\) concentrated load, and
- a \(1.2 kN/m\) uniformly distributed load of variable length.
The live load may act anywhere on the span. The following diagram illustrates the geometry of the beam to be designed including support conditions.

The first step in this problem is to identify where the maximum moment will occur. Here since it is a simply-supported beam, the location of the maximum moment is the mid-span of the beam. The next and second step is to construct the influence line and put values or ordinates on the influence line diagram. Consider simply a unit point load, \(P)\, as it moves along the length of the beam and compute the bending moment in the midspan. For simplicity, I only illustrate the value of the bending moment in the midspan at 5 locations of the point load (measured from the left hand side of the beam) which is shown in the following table.
| Location of unit point load (m) | Bending moment at midspan (kN m) |
|---|---|
| \(0\) | \(0\) |
| \(\frac{L}{4}\) | \(\frac{PL}{8}\) |
| \(\frac{L}{2}\) | \(\frac{PL}{4}\) |
| \(\frac{3L}{4}\) | \(\frac{PL}{8}\) |
| \(L\) | \(0\) |
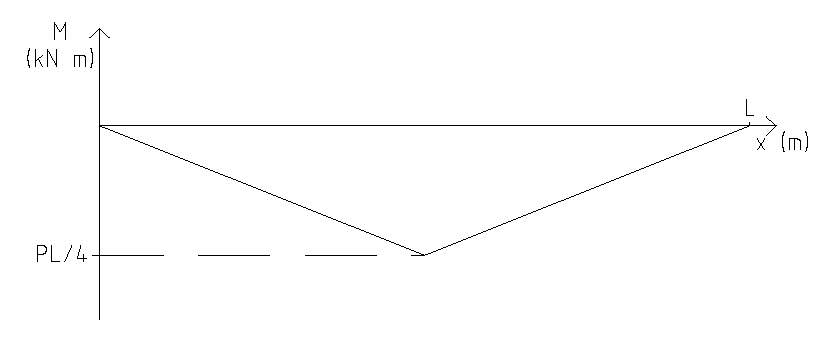
From these tabulated values, it may be inferred that the influence line (that is the effect of the moving load on the moment in the midspan of the beam) can be represented in diagram form below. It then follows that the maximum effect of a moving point load will be when the point load passes through the midspan as the influence line diagram has it's maximum ordinate there.

By constructing the influence line for a moving load, it becomes simpler to understand where the load must be located to produce the maximum load effect. It only becomes more complicated in real problems where multiple moving point loads exist in tandem (i.e. multi-axle vehicle loads) since the influence line diagram is not as intuitive. Here it is just a matter of tabulating values (i.e. of the midspan moment) based on a variety of loading locations and constructing the influence line diagram. Depending on the type of loading, this may or may not be cumbersome to calculate by hand and so a programmatic approach may be used to simulate the load moving across the span. One such programmatic approach written in MATLAB (by myself) is included here for a structure which consists of 1 span that is simply-supported. The source code for this programmatic approach can be found as this code snippet on Gitlab.
This has been a quick introduction and refresher on what the influence line method is, how it is useful, and why you should know about it. Hopefully, if you are reading this conclusion to my article, you understand the basic concept of influence lines and that it can be a powerful tool in your engineering toolbox to understand the effect of moving loads on a structure. Thank you for taking the time to read this article, it is most appreciated, and follow me on LinkedIN to get notified for future weekly blog posts.